EuroAPI Header EuroAPI Header

X

Find PharmaFlow Article for Insulin Glargine And Lixisenatide

PharmaCompass
API SUPPLIERS
API Suppliers

API Suppliers

0

US DMFs Filed

US DMFs Filed

0

CEP/COS Certifications

CEP/COS Certifications

0

JDMFs Filed

JDMFs Filed

0

EU WC

EU WC

0

Listed Suppliers

Listed Suppliers

0

API REF. PRICE (USD / KG)

0

INTERMEDIATES

0

DOSSIERS // FDF
USA (Orange Book)

USA (Orange Book)

0

Europe

Europe

0

Canada

Canada

0

Australia

Australia

0

South Africa

South Africa

0

Uploaded Dossiers

Uploaded Dossiers

0

GLOBAL SALES (USD Million)

U.S. Medicaid

0

Annual Reports

EXCIPIENTS

0

PATENTS & EXCLUSIVITIES

USFDA Orange Book Patents

0

USFDA Exclusivities

0

DIGITAL CONTENT

Blog #PharmaFlow

News

REF STANDARD

EDQM

0

USP

0

JP

0

Other Listed Suppliers

0

SERVICES

0

US market offers niche opportunities, reveals manufacturer sales data from Medicare Part D
This week, PharmaCompass reviews the recently released data of the Medicare Part D Prescription Drug Program in the United States for calendar year 2017. The US market is the world’s largest and most important pharmaceutical market, accounting around 45 percent of the global share of drugs, and was valued at US$ 466 billion in 2017. View Our Interactive Dashboard on Medicare Part D 2017 Spending (Free Excel Available) What is Medicare?   Medicare is the federal health insurance program in the US which covered 58.4 million people in 2017 — 49.5 million aged 65 and older, and 8.9 million disabled.  The National Health Expenditure (NHE) in the US grew 3.9 percent to US$ 3.5 trillion in 2017 and accounted for 17.9 percent of the gross domestic product (GDP). As a result, Medicare spending grew 4.2 percent to US$ 705.9 billion in 2017, or 20 percent of the total NHE. Prescription drug spending in the US increased to US$ 333.4 billion in 2017 while prescription drug coverage under the Medicare program, known as Medicare Part D, reached US$ 151.6 billion in 2017, a little less than half of the total prescription drug spending in the United States. View Our Interactive Dashboard on Medicare Part D 2017 Spending (Free Excel Available) Why has Medicare been in news?   The Medicare Part D drug benefit is delivered by private drug plans, which are mostly chosen by the program’s participants. Under Part D, drug prices are determined primarily through negotiations between Part D plans and providers (such as pharmacies and drug manufacturers). A key factor that helps Part D plans lower drug costs are rebate payments that the plans negotiate with drug manufacturers. With drug pricing debate raging in the United States, these rebate payments have come under a lot of scrutiny. View Our Interactive Dashboard on Medicare Part D 2017 Spending (Free Excel Available) During the hearing of Big Pharma executives summoned by the Senate Financing Committee last month, Sanofi’s CEO Olivier Brandicourt detailed a chart showing Sanofi and Genzyme's US sales from 2018, explaining how as much as 55 percent of Sanofi’s gross sales were given back to payers as rebates. The chart showed how out of Sanofi’s US$ 21.6 billion in gross sales in 2018, US$ 4.5 billion was given back in mandatory rebates to government payers and US$ 7.3 billion in discretionary rebates. Earlier this month, the Trump administration unveiled a budget that would reduce spending in Medicare as well as Medicaid by hundreds of billions of dollars compared to the current law. View Our Interactive Dashboard on Medicare Part D 2017 Spending (Free Excel Available) What are the insights available from the 2017 US Medicare Part D data?   The Medicare Drug Spending dashboards were updated earlier this month to include data for 2017, providing more data and transparency to better identify trends and track consumption and price changes over time.  Using the available data, PharmaCompass has developed its own dashboard to show recent trends in consumption of prescription drugs under Medicare D. Our dashboard also helps identify drugs with limited to no competition. The data reveals that while almost 60 percent of the Medicare spend (nearly US$ 90 billion) is for drugs with only one manufacturer, i.e. mostly patented drugs, there is another US$ 12 billion spend on drugs which have only two manufacturers. The next highest spend — of US$ 4 billion — is on drugs with as many as five manufacturers.  This clearly indicates that if the market can support up to five manufacturers for established products, increased generic competition will significantly help Medicare reduce its Part D prescription drug spending. View Our Interactive Dashboard on Medicare Part D 2017 Spending (Free Excel Available) Medicare’s highest spend was on Insulin Glargine (US$ 4.7 billion) followed by patented drugs Celgene’s Revlimid (lenalidomide), Bristol-Myers Squibb’s Eliquis (apixaban), Merck’s Januvia (sitagliptin phosphate) and AbbVie’s Humira (adalimumab).   Drugs with limited to no competition can be identified using the dashboard by sorting for drugs with few manufacturers.  Information is also provided on drug uses and clinical indications, thereby enabling comparison between different medications for a given condition. View Our Interactive Dashboard on Medicare Part D 2017 Spending (Free Excel Available)  

Impressions: 4725

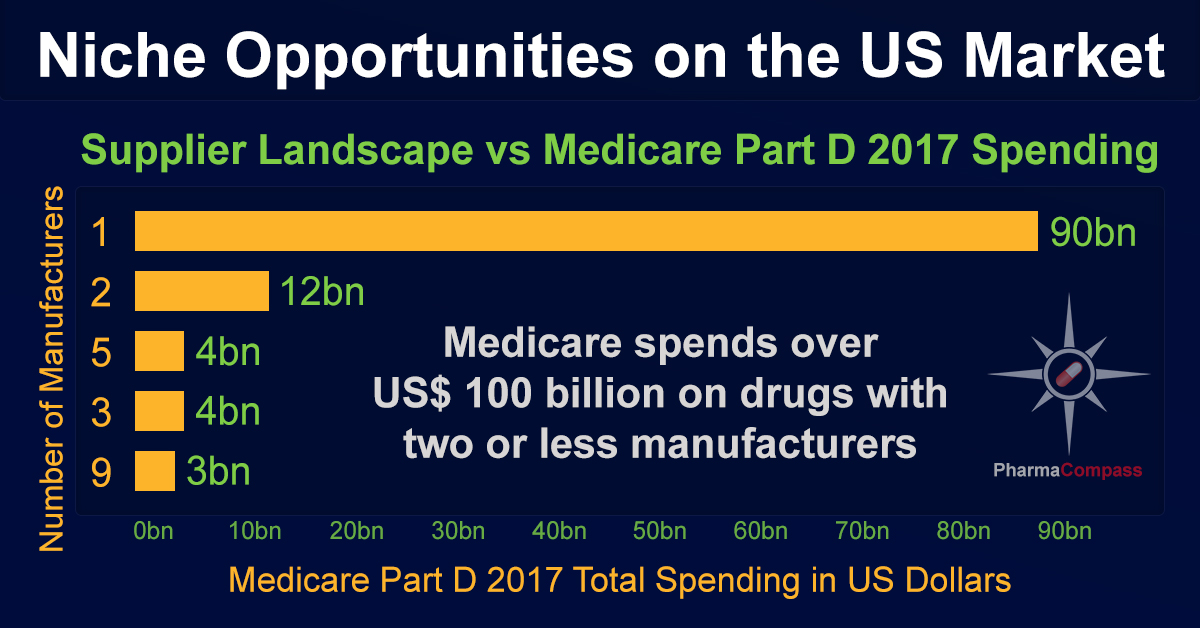
https://www.pharmacompass.com/radio-compass-blog/us-market-offers-niche-opportunities-reveals-manufacturer-sales-data-from-medicare-part-d

#PharmaFlow by PHARMACOMPASS
28 Mar 2019
Ask Us for Pharmaceutical Supplier and Partner
Ask Us, Find A Supplier / Partner
No Commissions, No Strings Attached, Get Connected for FREE

What are you looking for?

How can we help you?

The request can't be empty

Please read our Privacy Policy carefully

You must agree to the privacy policy

The name can't be empty
The company can't be empty.
The email can't be empty Please enter a valid email.
The mobile can't be empty
Post Enquiry
POST ENQUIRY