


This week PharmaCompass brings to you key highlights of the US Food and Drug Administration’s recently released June 2024 list of Off-Patent, Off-Exclusivity
Drugs without an Approved Generic (OPOE list). The list is a crucial
resource for promoting competition and affordability in the pharmaceutical
industry. Updated biannually in December and June, the OPOE list serves as a
transparent guide for drug manufacturers.
Since December 2021, the FDA has enhanced its transparency efforts by providing separate lists for prescription (Rx) and over-the-counter (OTC) drugs approved under a New Drug Application (NDA). This initiative is a significant cog in the FDA’s broader strategy to encourage the development and submission of Abbreviated New Drug Applications (ANDAs).
ANDAs are a streamlined pathway for generic drug development,
offering a more cost-effective alternative to brand-name drugs. By highlighting
drugs that lack generic competition on the OPOE list, FDA aims to incentivize
manufacturers to develop generics, ultimately leading to greater affordability
and access for patients.
Access the Interactive Dashboard on FDA's June 2024 List of Off-Patent Drugs (Free Excel)
ALS drugs, cancer, asthma,
HIV treatments among new drugs added to OPOE list
The December 2023 OPOE list had 23 new applications of branded
drugs eligible for but without generic competition. The June list further added
21 new applications of drugs that had never appeared before. These include bendamustine hydrochloride (to treat chronic
lymphocytic leukemia), fluticasone propionate (to treat asthma), maraviroc (to treat HIV-1 infection in
patients two years of age and older weighing at least 10 kilograms), carbamazepine (to treat epilepsy and
bipolar I disorder), and posaconazole (an antifungal agent indicated for Aspergillus and Candida infections). There are two other drugs on the list – edaravone and riluzole – to treat amyotrophic lateral sclerosis (ALS) or Lou Gehrig’s disease (a neurological disorder).
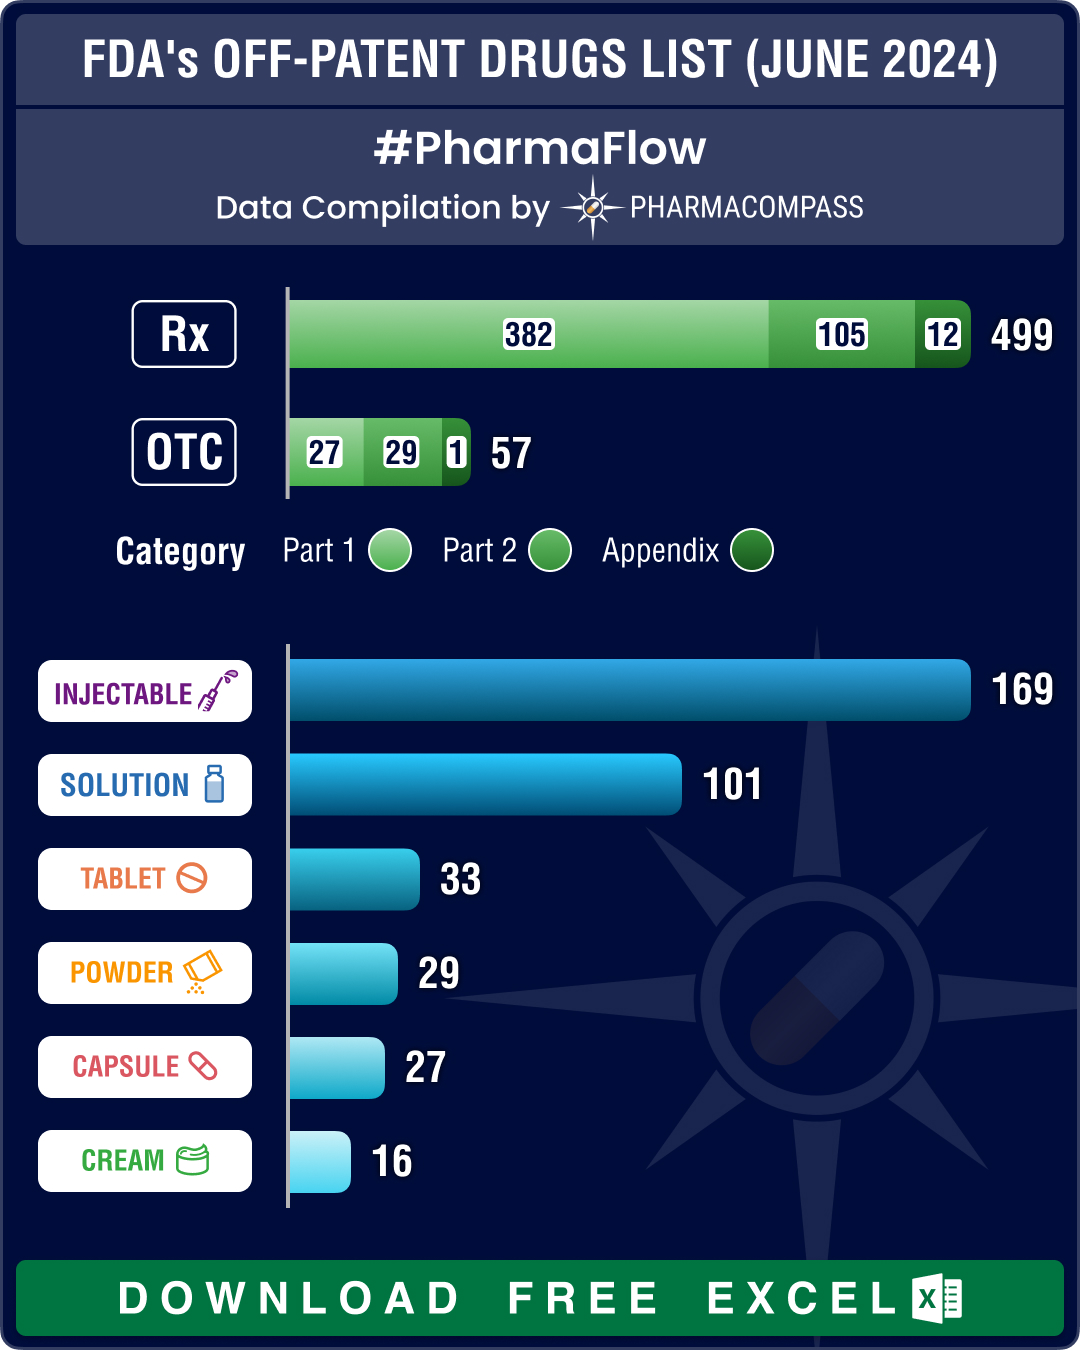
Much like the June 2023 OPOE list, nearly one-third of the prescription drugs listed are injectables – 170 out of 499. There are 74 prescription entries for oral solid dosage forms (such as tablets, capsules and modified release forms).
The June 2024 OPOE list has 57 OTC drugs, a tad shy of the 60 drugs in last year’s list. Among them are antihistamine drugs (used to treat allergies), cetirizine hydrochloride, nizatidine, famotidine, loratadine and anti-obesity medication orlistat.
The list also had a newly listed drug, which is a combination of chlorpheniramine maleate, ibuprofen and pseudoephedrine hydrochloride for treating allergic sinusitis. Out of the 57 OTC drug products on the list, 18 are delivered as oral solid dosage forms.
Access the Interactive Dashboard on FDA's June 2024 List of Off-Patent Drugs (Free Excel)
Novartis blockbusters lose exclusivity, Lupin wins FDA nod for copycat of Neurocrine’s bestseller
This year, several large-selling drugs from drugmakers like Eisai, AbbVie, Gilead, Sanofi, Fresenius Kabi and
others are due to face their first generic or biosimilar challengers in the US market. “First generics” are given for a first-to-file ANDA, for which there is no previously-approved ANDA by the FDA for the drug product.
The agency considers first generics to be important to public
health and prioritizes review of these submissions. First generics are eligible
for a 180-day exclusivity period.
Three of Novartis’ drugs have lost exclusivity so far, this year. These include Promacta/Revolade (eltrombopag) used to treat
thrombocytopenia (low platelet count). Promacta was approved in 2015 and saw sales of US$ 2.27 billion last year. Annora Pharma scored an FDA approval for eltrombopag’s first generic in April. Tasigna (nilotinib), the Swiss drugmaker’s oral treatment for Philadelphia chromosome-positive chronic myeloid leukemia (a kind of leukemia where patients have an abnormal
chromosome in their blood cells called the Philadelphia chromosome), got its
first generic in January, which was introduced by Apotex. Tasigna brought
in sales of US$ 1.85 billion in 2023 and its sales are
projected to plummet to US$ 79 million by 2029. Novartis’ Rydapt (midostaurin) for treating adult patients
with newly diagnosed acute myeloid leukemia (AML) also lost exclusivity in
April.
Neurocrine Biosciences’ top-selling drug Ingrezza (valbenazine) was the first FDA-approved
drug to treat tardive dyskinesia, a disorder that involves involuntary
movements. It raked in US$ 1.84 billion in 2023, registering a
year-on-year growth of 29 percent. In April, Lupin won FDA’s approval for the first generic of valbenazine capsules.
Access the Interactive Dashboard on FDA's June 2024 List of Off-Patent Drugs (Free Excel)
Our view
The Biden administration has been pushing hard to lower the price of prescription drugs. It is one of President Joe Biden’s central campaign promises this year. However, lowering drug prices is a bipartisan issue in the US. So whether a republican or
a democrat takes over the US administration, making medicines affordable should
remain a priority.
In 2023, generic drugs accounted for US$ 424 billion of the US$ 1.6 trillion global pharmaceutical market. A determined FDA that is proactively looking to approve generic drugs will no doubt help this segment grow even further.
Impressions: 2500
https://www.pharmacompass.com/radio-compass-blog/fda-s-june-2024-list-of-off-patent-off-exclusivity-drugs-sees-rise-in-cancer-hiv-treatments
#PharmaFlow by PHARMACOMPASS
11 Jul 2024
Acquisitions and spin-offs dominated headlines in 2019 and the tone was set very early with Bristol-Myers Squibb acquiring
New Jersey-based cancer drug company Celgene in a US$ 74 billion deal announced on
January 3, 2019. After factoring
in debt, the deal value ballooned to about US$ 95 billion, which according
to data compiled by Refinitiv, made it the largest healthcare deal on
record.
In the summer, AbbVie Inc,
which sells the world’s best-selling drug Humira, announced its acquisition of Allergan Plc, known for Botox and other cosmetic
treatments, for US$ 63 billion. While the companies are still awaiting
regulatory approval for their deal, with US$ 49 billion in combined 2019
revenues, the merged entity would rank amongst the biggest in the industry.
View Our Interactive Dashboard on Top drugs by sales in 2019 (Free Excel Available)
The big five by pharmaceutical sales — Pfizer,
Roche, J&J, Novartis and Merck
Pfizer
continued
to lead companies by pharmaceutical sales by reporting annual 2019 revenues of
US$ 51.8 billion, a decrease of US$ 1.9 billion, or 4 percent, compared to
2018. The decline was primarily attributed to the loss of exclusivity of Lyrica in 2019,
which witnessed its sales drop from US$ 5 billion in 2018 to US$ 3.3 billion in
2019.
In 2018, Pfizer’s then incoming CEO Albert Bourla had mentioned that the company did not see the need for any large-scale M&A activity as Pfizer had “the best pipeline” in its history, which needed the company to focus on deploying its capital to keep its pipeline flowing and execute on its drug launches.
Bourla stayed true to his word and barring the acquisition of Array Biopharma for US$ 11.4 billion and a spin-off to merge Upjohn, Pfizer’s off-patent branded and generic established medicines business with
Mylan, there weren’t any other big ticket deals which were announced.
The
Upjohn-Mylan merged entity will be called Viatris and is expected to have 2020
revenues between US$ 19 and US$ 20 billion
and could outpace Teva to
become the largest generic company in the world, in term of revenues.
Novartis, which had
followed Pfizer with the second largest revenues in the pharmaceutical industry
in 2018, reported its first full year earnings after spinning off its Alcon eye
care devices business division that
had US$ 7.15 billion in 2018 sales.
In 2019,
Novartis slipped two spots in the ranking after reporting total sales of US$
47.4 billion and its CEO Vas Narasimhan continued his deal-making spree by buying New
Jersey-headquartered The Medicines Company (MedCo) for US$ 9.7
billion to acquire a late-stage cholesterol-lowering
therapy named inclisiran.
As Takeda Pharmaceutical Co was
busy in 2019 on working to reduce its debt burden incurred due to its US$ 62
billion purchase of Shire Plc, which was announced in 2018, Novartis also purchased
the eye-disease medicine, Xiidra, from the Japanese drugmaker for US$ 5.3 billion.
Novartis’ management also spent a considerable part of 2019 dealing with data-integrity concerns which emerged from its 2018 buyout of AveXis, the
gene-therapy maker Novartis had acquired for US$ 8.7 billion.
The deal gave Novartis rights to Zolgensma,
a novel treatment intended for children less than two years of age with the
most severe form of spinal muscular atrophy (SMA). Priced at US$ 2.1 million,
Zolgensma is currently the world’s most expensive drug.
However,
in a shocking announcement, a month after approving the drug, the US Food and
Drug Administration (FDA) issued a press release on
data accuracy issues as the agency was informed by AveXis that
its personnel had manipulated data which
the FDA used to evaluate product comparability and nonclinical (animal)
pharmacology as part of the biologics license application (BLA), which was
submitted and reviewed by the FDA.
With US$
50.0 billion (CHF 48.5 billion) in annual pharmaceutical sales, Swiss drugmaker
Roche came in at number two position in 2019
as its sales grew 11 percent driven by
its multiple sclerosis medicine Ocrevus, haemophilia drug Hemlibra and cancer medicines Tecentriq and Perjeta.
Roche’s newly introduced medicines generated US$ 5.53 billion (CHF 5.4 billion) in growth, helping offset the impact of the competition from biosimilars for its three best-selling drugs MabThera/Rituxan, Herceptin and Avastin.
In late 2019, after months of increased
antitrust scrutiny, Roche completed
its US$ 5.1 billion acquisition of Spark Therapeutics to strengthen its presence in
gene therapy.
Last year, J&J reported almost flat worldwide sales of US$ 82.1 billion. J&J’s pharmaceutical division generated US$ 42.20 billion and its medical devices and consumer health divisions brought in US$ 25.96 billion and US$ 13.89 billion respectively.
Since J&J’s consumer health division sells analgesics, digestive health along with beauty and oral care products, the US$ 5.43 billion in consumer health sales from over-the-counter drugs and women’s health products was only used in our assessment of J&J’s total pharmaceutical revenues. With combined pharmaceutical sales of US$ 47.63 billion, J&J made it to number three on our list.
While the sales of products like Stelara, Darzalex, Imbruvica, Invega Sustenna drove J&J’s pharmaceutical business to grow by 4 percent over 2018, the firm had to contend with generic competition against key revenue contributors Remicade and Zytiga.
US-headquartered Merck, which is known as
MSD (short for Merck Sharp & Dohme) outside the United States and
Canada, is set to significantly move up the rankings next year fueled by its
cancer drug Keytruda, which witnessed a 55
percent increase in sales to US$ 11.1 billion.
Merck reported total revenues of US$ 41.75 billion and also
announced it will spin off its women’s health drugs,
biosimilar drugs and older products to create a new pharmaceutical
company with US$ 6.5 billion in annual revenues.
The firm had anticipated 2020 sales between US$ 48.8 billion and US$ 50.3 billion however this week it announced that the coronavirus pandemic will reduce 2020 sales by more than $2 billion.
View Our Interactive Dashboard on Top drugs by sales in 2019 (Free Excel Available)
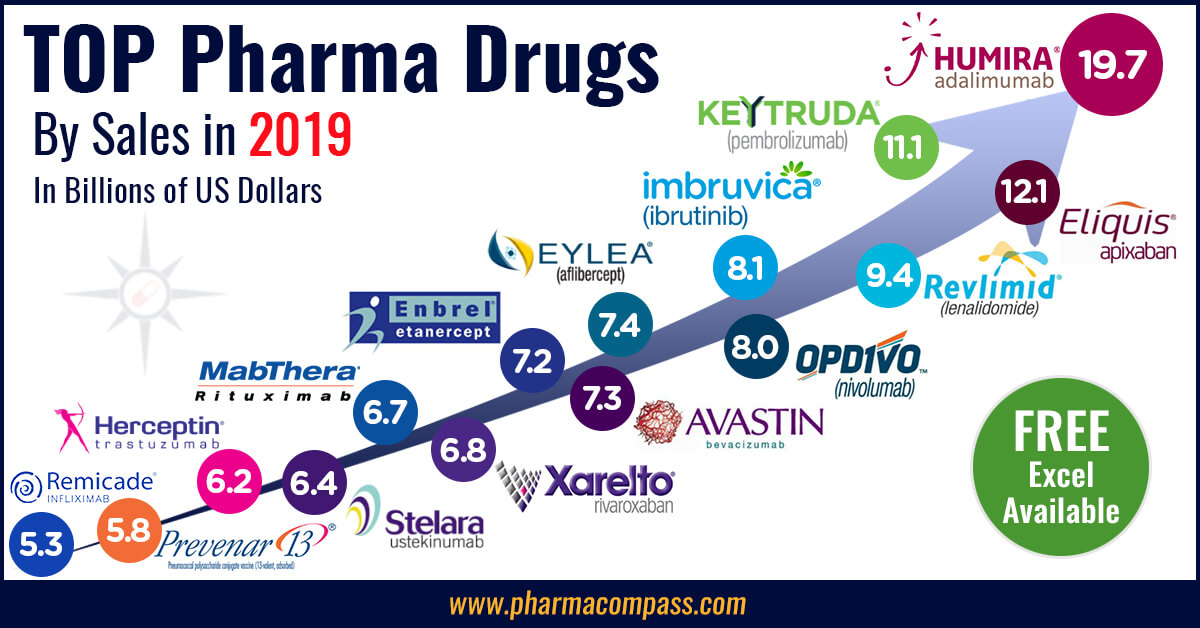
Humira holds on to remain world’s best-selling drug
AbbVie’s acquisition of Allergan comes as the firm faces the expiration of patent protection for Humira, which brought in a staggering US$ 19.2 billion in sales last year for
the company. AbbVie has failed to successfully acquire or develop a major new
product to replace the sales generated by its flagship drug.
In 2019, Humira’s US revenues increased 8.6 percent to US$ 14.86 billion while internationally, due
to biosimilar competition, the sales dropped 31.1 percent to US$ 4.30 billion.
Bristol Myers Squibb’s Eliquis, which is also marketed by Pfizer, maintained its number two position
and posted total sales of US$ 12.1 billion, a 23 percent increase over 2018.
While Bristol Myers Squibb’s immunotherapy treatment Opdivo, sold in partnership with Ono in Japan, saw sales increase from US$ 7.57 billion to US$ 8.0 billion, the growth paled in comparison to the US$ 3.9
billion revenue increase of Opdivo’s key immunotherapy competitor Merck’s Keytruda.
Keytruda took the number three spot in drug sales that
previously belonged to Celgene’s Revlimid, which witnessed a sales decline from US$ 9.69 billion to US$ 9.4 billion.
Cancer treatment Imbruvica, which is marketed
by J&J and AbbVie, witnessed a 30 percent increase in sales. With US$ 8.1
billion in 2019 revenues, it took the number five position.
View Our Interactive Dashboard on Top drugs by sales in 2019 (Free Excel Available)
Vaccines – Covid-19 turns competitors into partners
This year has been dominated by the single biggest health emergency in years — the novel coronavirus (Covid-19) pandemic. As drugs continue to fail to meet expectations, vaccine development has received a lot of attention.
GSK reported the highest vaccine sales of all drugmakers with
total sales of US$ 8.4 billion (GBP 7.16 billion), a significant portion of its
total sales of US$ 41.8 billion (GBP 33.754 billion).
US-based Merck’s vaccine division also reported a significant increase in sales to US$ 8.0 billion and in 2019 received FDA and EU approval to market its Ebola vaccine Ervebo.
This is the first FDA-authorized vaccine against the deadly virus which causes
hemorrhagic fever and spreads from person to person through direct contact with
body fluids.
Pfizer and Sanofi also reported an increase in their vaccine sales to US$ 6.4
billion and US$ 6.2 billion respectively and the Covid-19 pandemic has recently
pushed drugmakers to move faster than ever before and has also converted
competitors into partners.
In a rare move, drug behemoths — Sanofi and GlaxoSmithKline (GSK) —joined hands to develop a vaccine for the novel coronavirus.
The two companies plan to start human trials
in the second half of this year, and if things go right, they will file
for potential approvals by the second half of 2021.
View Our Interactive Dashboard on Top drugs by sales in 2019 (Free Excel Available)
Our view
Covid-19 has brought the world economy to a grinding halt and shifted the global attention to the pharmaceutical industry’s capability to deliver solutions to address this pandemic.
Our compilation shows that vaccines and drugs
for infectious diseases currently form a tiny fraction of the total sales of
pharmaceutical companies and few drugs against infectious diseases rank high on
the sales list.
This could well explain the limited range of
options currently available to fight Covid-19. With the pandemic currently infecting
over 3 million people spread across more than 200 countries, we can safely
conclude that the scenario in 2020 will change substantially. And so should our
compilation of top drugs for the year.
View Our Interactive Dashboard on Top drugs by sales in 2019 (Free Excel Available)
Impressions: 55104
https://www.pharmacompass.com/radio-compass-blog/top-drugs-and-pharmaceutical-companies-of-2019-by-revenues
#PharmaFlow by PHARMACOMPASS
29 Apr 2020

We always knew math was fuzzy, but never imagined addition could get so
complicated.
A recent publication on 2014 Global Prescription Medication Statistics listed the top pharmaceutical corporations by revenues, the best
selling products along with the top therapy areas.
The list, based on data published by IMS Health,
caught us by surprise since a previous publication by FiercePharma had a completely different order when ranking the top 15 pharmaceutical
companies.
As the difference in revenues of the top-10 companies was in excess of $60 billion and IMS Health’s data is an industry standard for decision making, we dug deeper to analyze the correlation between the information in the annual reports and IMS Health’s statistics.
Which pharmaceutical company is the largest?
Simply put, the answer is, ‘it depends’ on how you define a pharmaceutical company.
Should divisions like diagnostics, animal health, vaccines, consumer
health be counted when determining the size of a pharmaceutical company?
FiercePharma, in their analysis, used the total
revenue of all divisions of the organizations to determine the largest
organization; in their case it is Johnson & Johnson.
IMS determines their numbers by measuring “prescription sales and dispensing” and hence, excludes divisions like diagnostics, consumer health and animal health, making Novartis the largest
company.
As currency exchange rate fluctuations have their own, big role, in
determining the size of organizations, we believed it would be best to share
the revenues, as presented, so that you can draw your own conclusions.
Table 1/ Sales comparison for top pharmaceutical companies in 2014 from different sources (IMS, Fierce Pharma and Annual Reports)
Big Pharma
IMS Rank
IMS Sales
(US $Mn)
Fierce Pharma Rank
Fierce Pharma Sales (US $Mn)
Group Sales based on the Annual Report
(Currency as reported, Mn)
Novartis
1
51,307
2
57,996
USD
57,996
Pfizer
2
44,929
4
49,605
USD
49,605
Sanofi
3
40,037
5
43,070
Euro
33,770
Roche
4
37,607
3
49,866
CHF 49,866
Merck & Co
5
36,550
6
42,237
USD
42,237
Johnson &
Johnson
6
36,422
1
74,331
USD
74,331
AstraZeneca
7
33,313
8
26,095
USD
26,095
Glaxo SmithKline
8
31,470
7
37,960
GBP
23,006
Teva
9
26,001
11
20,272
USD
20,272
Gilead Sciences
10
23,673
10
24,474
USD
24,890
Amgen
11
20,473
12
20,063
USD
20,063
Lilly
12
19,909
14
19,615
USD 19,615
AbbVie
13
19,049
13
19,960
USD
19,960
Bayer
14
18,347
9
25,470
Euro
42,239
Bristol-Myers
Squibb
Not
in Top 20
15
15,879
USD
15,879
NB: Mn is million
Click here to access and download all
the 2014 data (Excel version available) for FREE!
Since each group has multiple divisions, we further split the sales for
you to brainstorm:
Table 2/ Sales comparison of the different divisions of top
pharmaceutical companies in 2014 (Annual Reports in Mn)
Big Pharma
Pharma Division
Vaccine Division
Generics
Consumer Health
Other Divisions
Medical Devices/ Diagnostics Division
Animal Health Division
Divestures/ Other adjustments
Novartis
USD 31,791
Sandoz USD 9,562
Alcon USD 10,827
USD 5,816
Pfizer
USD 45,708
USD 3,446
USD 451
Sanofi
Euro 22,578
Euro 3,974
Euro 1,805
Euro 3,337
Euro 2,076
Roche
CHF 38,969
CHF 10,897
Merck & Co
USD 30,740
USD 5,302
USD 6,195
Johnson &
Johnson
USD 32,313
USD 14,496
USD 27,522
AstraZeneca
USD 26,095
Glaxo SmithKline
GBP 18,670
GBP 4,336
Teva
USD 10,458
USD 9,814
Gilead Sciences
USD 24,474
USD 416
Amgen
USD
19,327
USD 736
Lilly
USD 16,481
USD 788
USD 2,346
AbbVie
USD 19,960
Bayer
Euro 12,052
Euro 7,923
Euro 22,264
Bristol-Myers
Squibb
USD 15,879
Click here to access and download all
the 2014 data (Excel version available) for FREE!
Not sure that it adds any extra clarity on what should define a global pharmaceutical company…
Since the various divisions make
companies complicated to assess, what about product sales?
The good news is that we have a winner!
Humira®, AbbVie’s monoclonal antibody Adalimumab, used to treat rheumatoid and other types of arthritis, is the highest selling product globally. IMS reported Humira’s annual sales for 2014 at $11,844 million, while AbbVie mentions their sales of Humira at $12,543 million, the difference: a mere $700 million! However, with IMS gathering data across various points of the supply chain, and the recent volatility of the currency markets, we believe that a difference of 5.5% of total sales is within range of reason.
Unfortunately, things stopped making sense the moment we reached the
number-two product on the IMS list. Lantus®,
Sanofi’s insulin glargine, recorded sales of Euro 6,344 million (based on Sanofi’s 2014 annual report), while IMS mentions Lantus sales were $10,331 million last year. In addition, Sanofi has an 11% growth rate reported while IMS indicates a growth of 30%.
So unless the Euro/Dollar exchange rate moves back towards the 1.5
range, there seems to be a serious difference in the way the product sales are
calculated by companies and by IMS.
Using information available in the annual reports and other company declarations, we attempted to compare IMS’ Top 20 Global Products 2014 with available public information, to only find more complications!
Table 3/ Sales comparison of the top pharmaceutical products in 2014 (IMS vs Annual Reports)
Products
IMS Rank
IMS Sales (US $Mn)
Annual Reports Sales (US $Mn)
Pharma
Compass Rank
Big Pharma
Currency
Annual Reports Sales in Mn
Marketing Partner
Marketing Partner Annual Report Sales
(US $Mn)
Humira®
1
11,844
12,543
1
Abbvie
USD
12,543
Lantus®
2
10,331
7,676
5
Sanofi
Euro
6,344
Sovaldi®
3
9,375
10,283
2
Gilead Sciences
USD
10,283
Abilify®
4
9,285
7,556
6
Bristol
Myers-Squibb
USD
2,020
Otsuka
5,536
Enbrel®
5
8,707
8,538
4
Amgen
USD
4,688
Pfizer
3,850
Seretide®
6
8,652
6,589
8
GSK
GBP
4,229
Crestor®
7
8,473
5,512
11
AstraZeneca
USD
5,512
Remicade®
8
8,097
9,880
3
Johnson &
Johnson
USD
6,868
Merck & Co.
2,372
Mitsubishi
Tanabe
640
Nexium®
9
7,681
3,655
19
AstraZeneca
USD
3,655
Mabthera®
10
6,552
6,936
7
Roche
CHF
5,603
Roche
1,305
Avastin®
11
6,070
6,449
9
Roche
CHF
6,417
Lyrica®
12
6,002
5,168
12
Pfizer
USD
5,168
Herceptin®
13
5,564
6,306
10
Roche
CHF
6,275
Spiriva®
14
5,483
3,917
17
Boehringer
Euro
3,237
Januvia®
15
4,991
3,931
16
Merck & Co.
USD
3,931
Copaxone®
16
4,788
4,237
14
Teva
USD
4,237
Novorapid®
17
4,718
2,835
20
Novo Nordisk
DKK
17,449
Neulasta®
18
4,627
4,596
13
Amgen
USD
4,596
Symbicort®
19
4,535
3,801
18
AstraZeneca
USD
3,801
Lucentis®
20
4,437
4,152
15
Novartis
USD
2,441
Roche
1,711
Click here to access and download all
the 2014 data (Excel version available) for FREE!
It’s clear that the methods used to determine product sales are considerably different between IMS and the pharmaceutical companies, however there is a range of consistency as well. How accurate is each information really depends on the analyst’s point of view.
Our take:
With over $350 billion in total sales, we have provided our raw data for your review since we are certain that there are opportunities worth capitalizing
upon and others, which may not be worthwhile to pursue.
While the assessment of pharmaceutical sales is far more complicated
than what we had originally imaged, the focus of Big Pharma on small molecules
is on Hepatitis C drugs (Sofosbuvir, Olysio, AbbVie Hep C), blood thinners, Eliquis® (Apixaban), Xarelto®(Rivaroxaban) and of course ‘tinib’ cancer treatments.
Table 4/ Growth of ‘tinib’ cancer treatments in 2014 (Annual Reports)
Products
Big Pharma
Sales (US $Mn) 2013
Sales (US $Mn) 2014
Growth (%)
Ibrutinib
Pharmacyclics,
Inc
(now
AbbVie)
14
492
3414%
Dasatinib
Bristol-Myers
Squibb
1280
1493
17%
Trametinib
GSK
10
68
580%
Nilotinib
Novartis
1266
1529
21%
Ruxolitinib
Novartis
163
279
71%
Ceritinib
Novartis
Not
launched
31
Sunitinib
Maleate
Pfizer
1204
1174
-2%
Crizotinib
Pfizer
282
438
55%
Axitinib
Pfizer
319
410
29%
Tofacitinib
Citrate
Pfizer
114
308
170%
Click here to access and download all
the 2014 data (Excel version available) for FREE!
However, Big Pharma is now all about biologics.
IMS’s data indicates that the top 10 products have only 5 biologics, while our calculations have 8 out of the top 10 products as biologics. The future strategy is best summed up by the statement in Bristol-Myers Squibb’s annual report “Just 5 years ago, we had about 40% of our development projects in biologics. If we look forward 3-5 years, we believe that number could potentially grow to about 75%”.
The barriers of entry for generic competition and potential windfalls have made rivals come together to co-market Synagis® (AbbVie & AstraZeneca), Remicade® (Johnson & Johnson, Merck and Tanabe), Xolair® and Lucentis® (Roche & Novartis).
Our pharmaceutical whisper (phisper): join the bio-age or bio-degrade!
Impressions: 12833
https://www.pharmacompass.com/radio-compass-blog/who-has-the-biggest-one-sales-of-the-top-pharma-products-by-revenue
#PharmaFlow by PHARMACOMPASS
23 Apr 2015