


DMF filings rise 4.5% in Q3 2025; China holds lead, India records 20% growth in submissions
The
third quarter (Q3) of 2025 witnessed a steady rise in Drug Master File (DMF) submissions to the
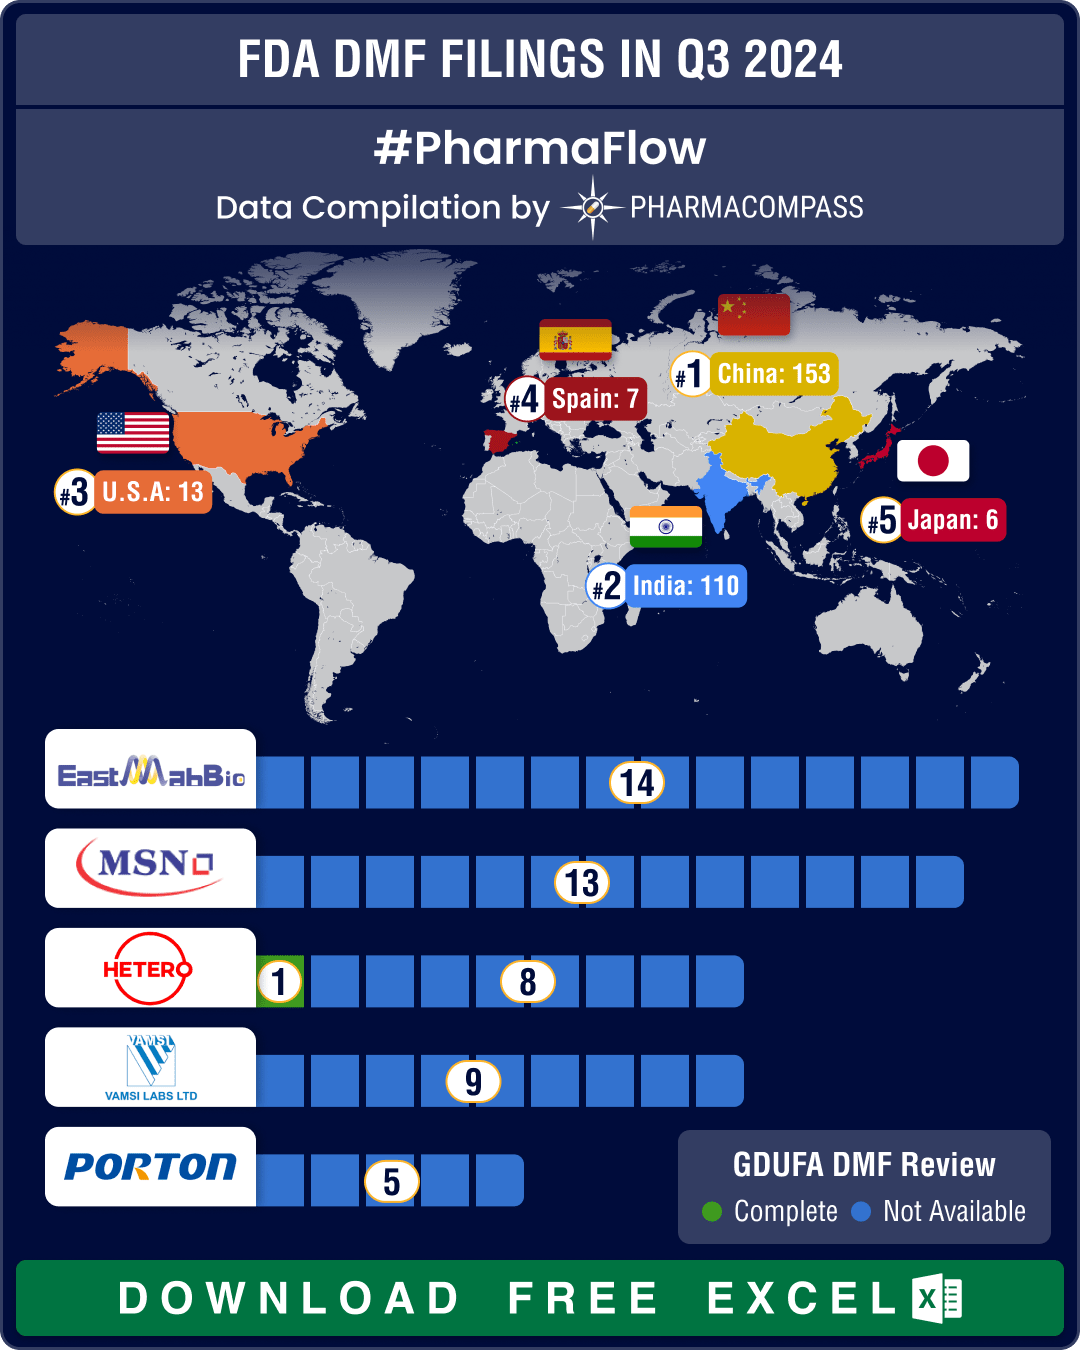
DMF filings hit all-time high in Q3 2024; China tops list with 58% increase in Type II submissions
Drug Master Files, or DMFs, are confidential documents that play a crucial role in the pharmaceutica
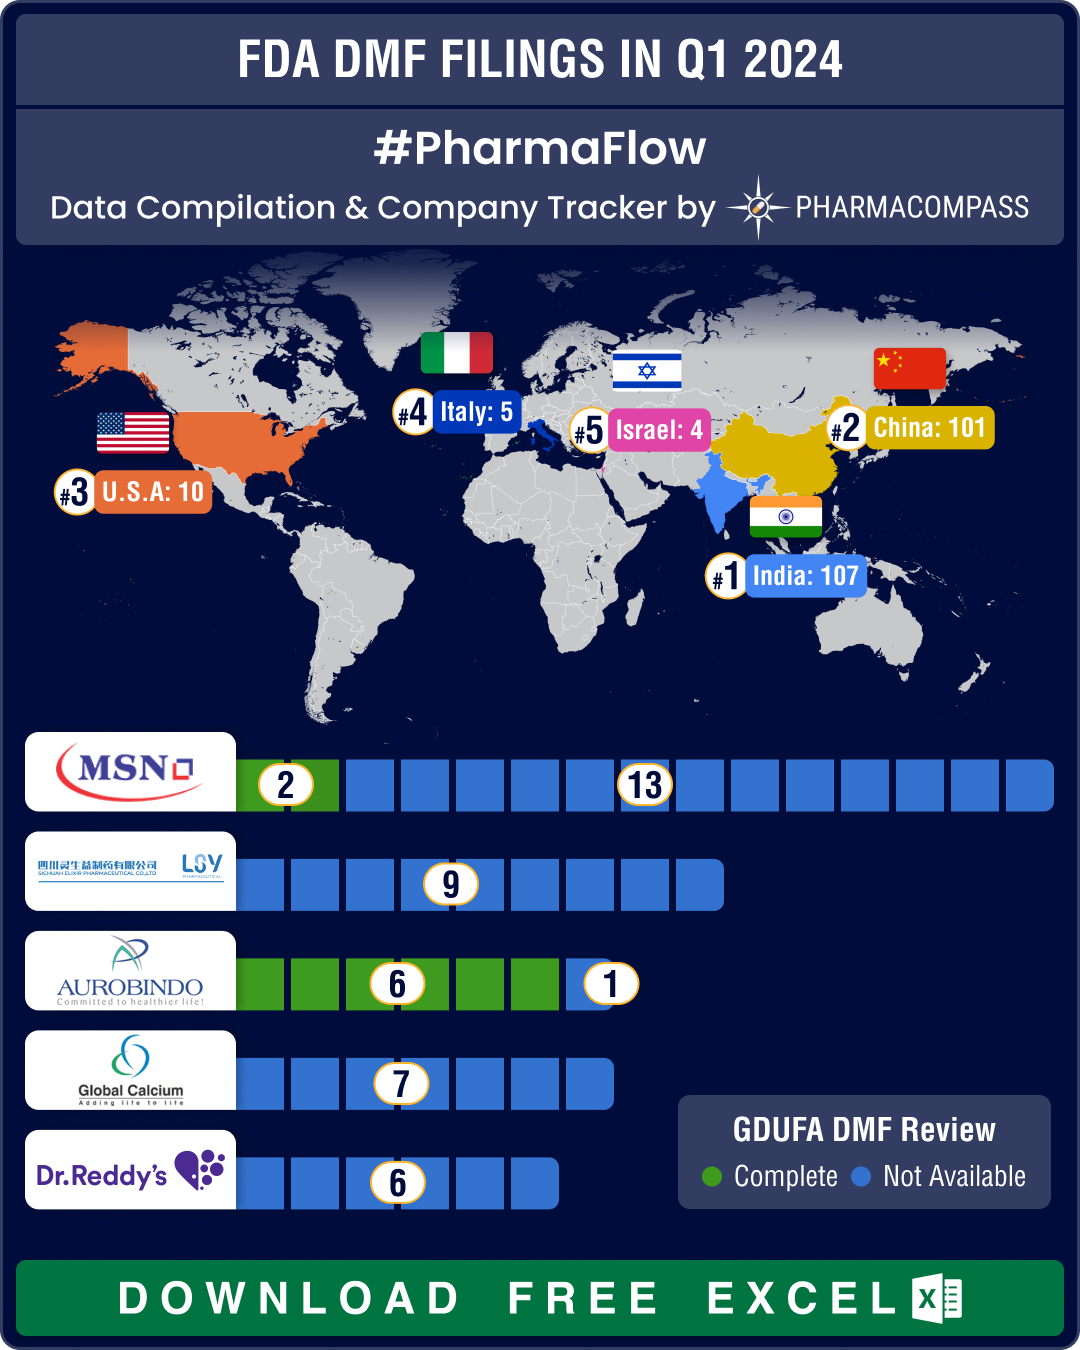
DMF submissions from China jump 42% as India continues to top list in Q1 2024
Generic drugs play a crucial role in providing access to life-saving drugs at affordable prices. To
- Privacy policy
- Terms and conditions
- Disclaimers
-

- Product listings are provided for informational purposes only. We do not supply or sell any products. Any products that may be covered by patent(s) are supplied solely for uses permitted under Section 107A of the Indian Patents Act and not for commercial sale.